Python 3 package for illustrating crystallography
Python 3 package for illustrating crystallography
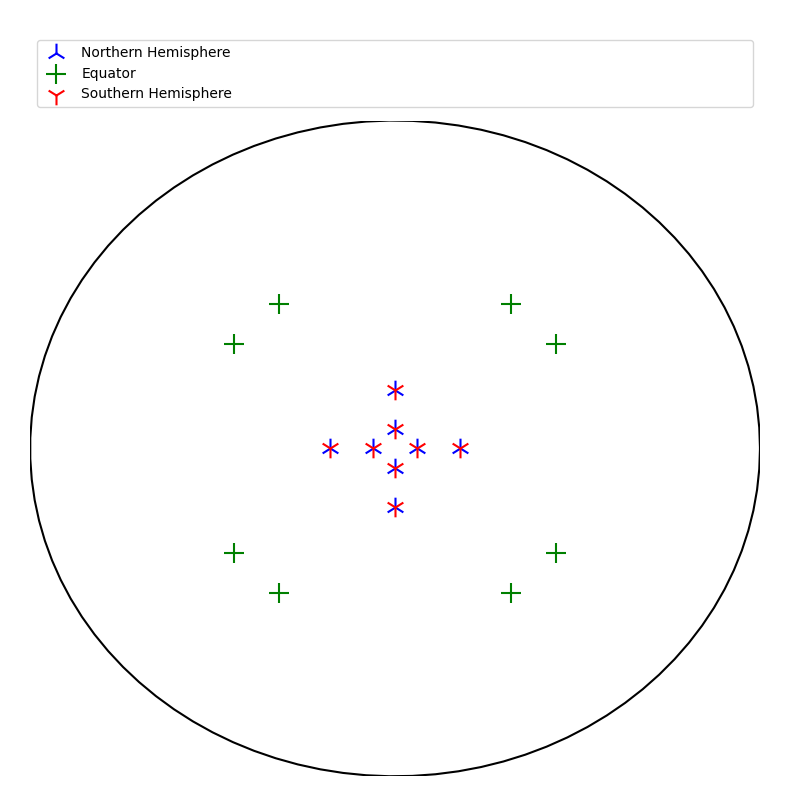
The projections in this package work by projecting points that lie on a sphere on a 2d disc about the equator. Points in the northern hemisphere will be mapped towards the south pole and points in the southern hemisphere will be mapped towards the northpole.

import matplotlib.pyplot as plt
from mpl_toolkits.mplot3d import Axes3D
from PyCrystallography.geometry import *
from PyCrystallography.stereographic_projection import Stereographic_projection
fig = plt.figure(0,figsize=[8,8])
ax = fig.add_subplot(111,projection='3d')
######################################
# which ever 3d model you want to load
cuboid(ax,5,5,5)
######################################
r = max(h,w,d)
points=normal_points(ax,faces,r)
Stereographic_projection(ax,points,r)
plt.show()

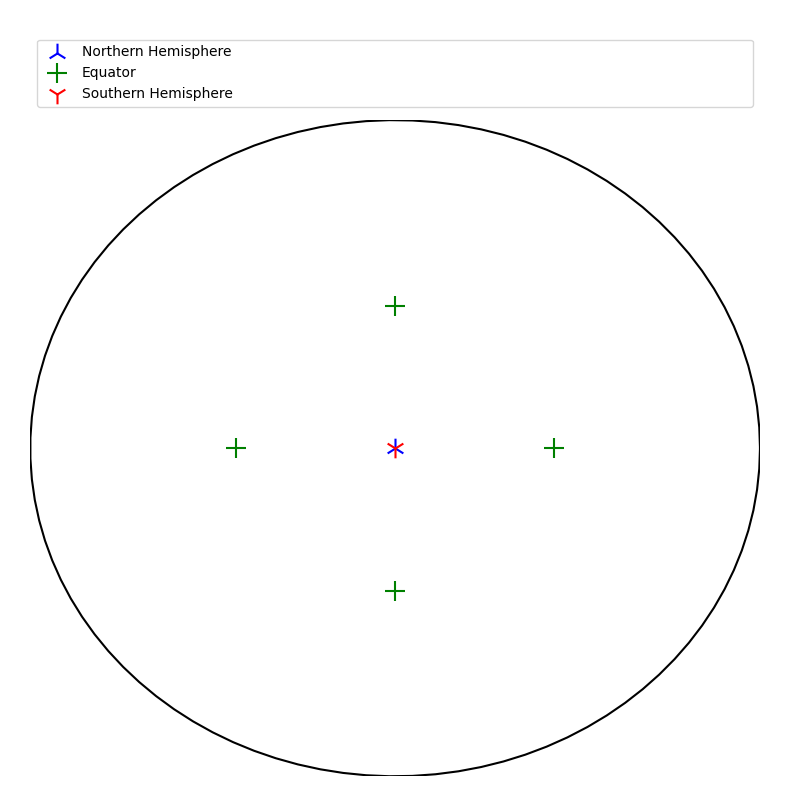
fig = plt.figure(0,figsize=[8,8])
ax = fig.add_subplot(111,projection='3d')
faces = pyramid(ax,1,0.5,3)
points=normal_points(ax,faces,1)
Stereographic_projection(ax,points,1,'stereographic_projection_pyramid')
plt.show()
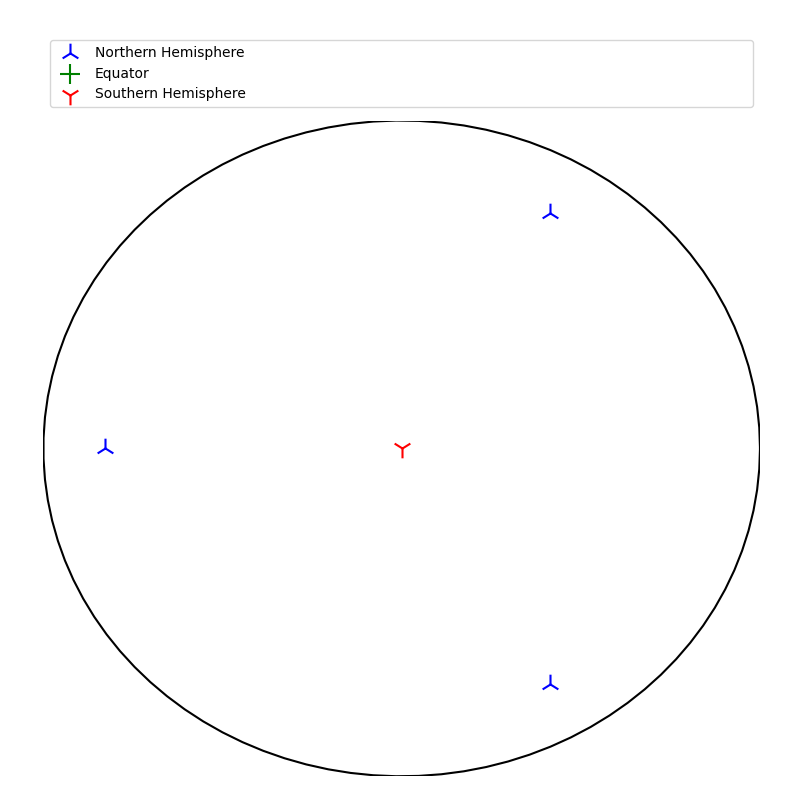
fig = plt.figure(0,figsize=[8,8])
ax = fig.add_subplot(111,projection='3d')
faces = bipyramid(ax,1,0.5,6)
points=normal_points(ax,faces,1)
Stereographic_projection(ax,points,2,'stereographic_projection_bipyramid')
plt.show()
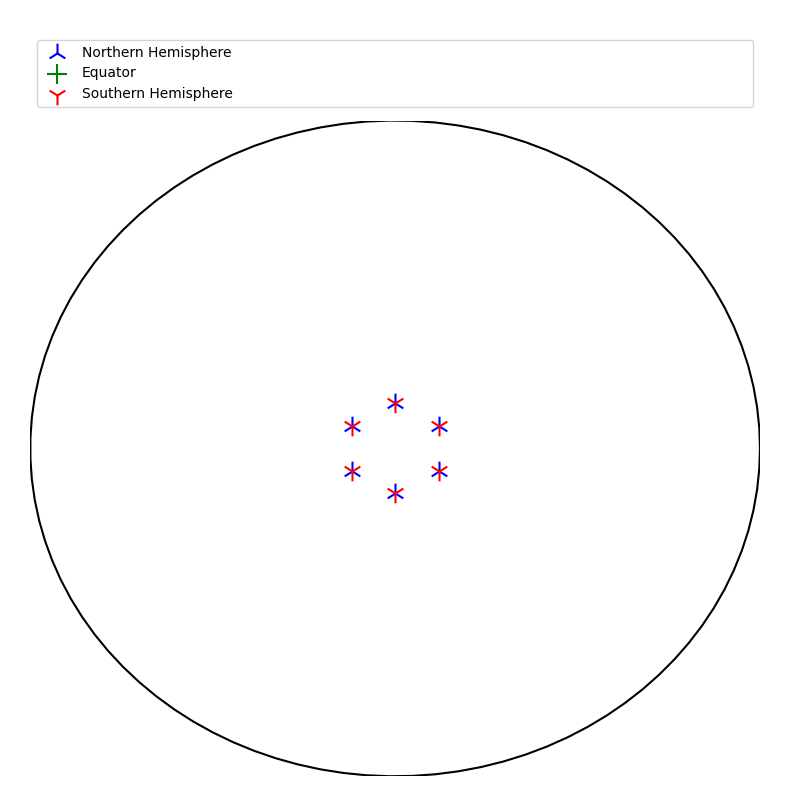
fig = plt.figure(0,figsize=[8,8])
ax = fig.add_subplot(111,projection='3d')
faces = prism(ax,2,2,6)
points=normal_points(ax,faces,2)
Stereographic_projection(ax,points,2,'stereographic_projection_prism')
plt.show()

fig = plt.figure(0,figsize=[8,8])
ax = fig.add_subplot(111,projection='3d')
faces = biprismid(ax,3,1,0.5,5)
points=normal_points(ax,faces,3)
Stereographic_projection(ax,points,3,'stereographic_projection_prism')
plt.show()
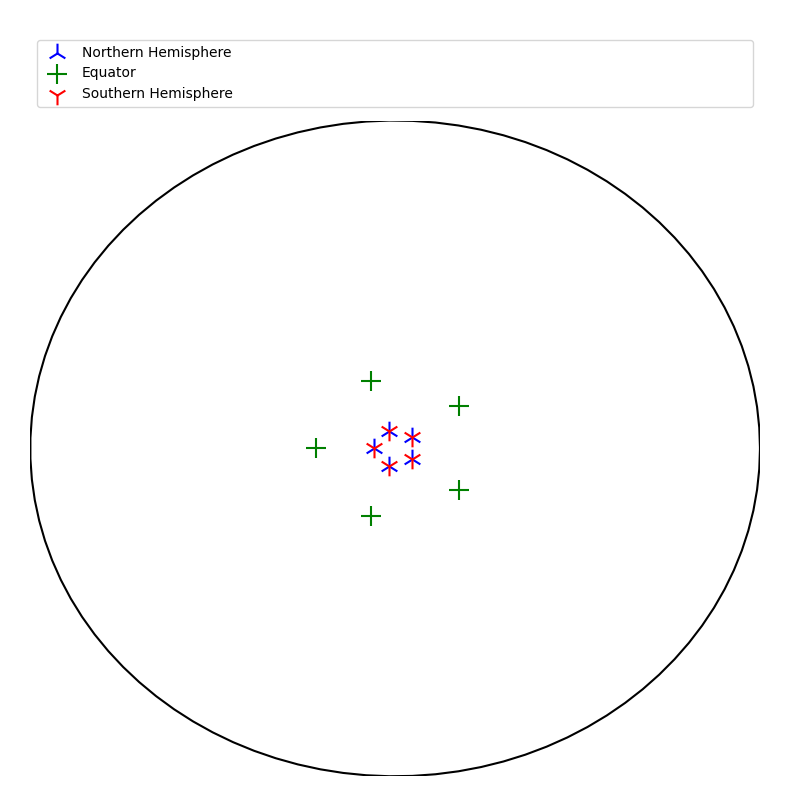
fig = plt.figure(0,figsize=[8,8])
ax = fig.add_subplot(111,projection='3d')
faces = tetrakis(ax,4,1)
points=normal_points(ax,faces,5)
Stereographic_projection(ax,points,5,'stereographic_projection_tetrakis')
plt.show()
There are 32 point group classifications for symmetries in crystallography. They are classified by:
import matplotlib.pyplot as plt
from mpl_toolkits.mplot3d import Axes3D
from PyCrystallography.geometry import *
from PyCrystallography.stereographic_projection import *
fig = plt.figure(0,figsize=[8,8])
ax = fig.add_subplot(111,projection='3d')
######################################
# which ever 3d model you want to load
faces=cuboid(ax,5,5,5)
######################################
points=normal_points(ax,faces,5)
northern_points,southern_points=Stereographic_projection(points,3,'test')
identify_fold_symmetry(northern_points,southern_points)
NFOLD = 5