Python 3 package for illustrating crystallography
Python 3 package for illustrating crystallography
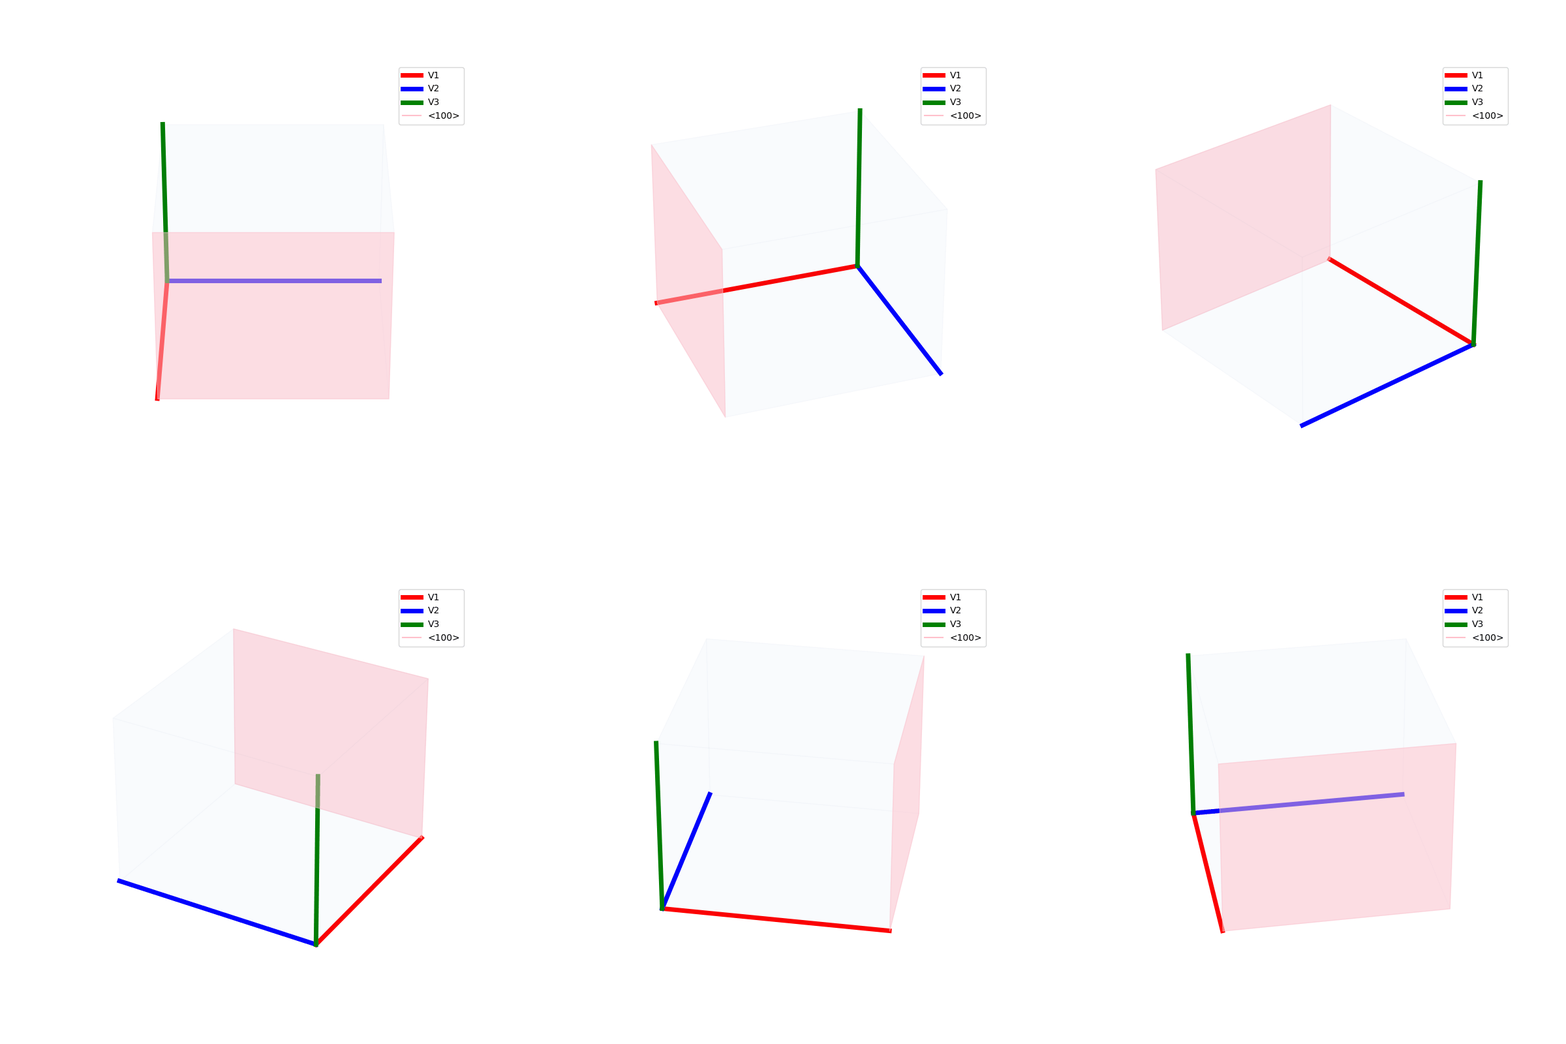
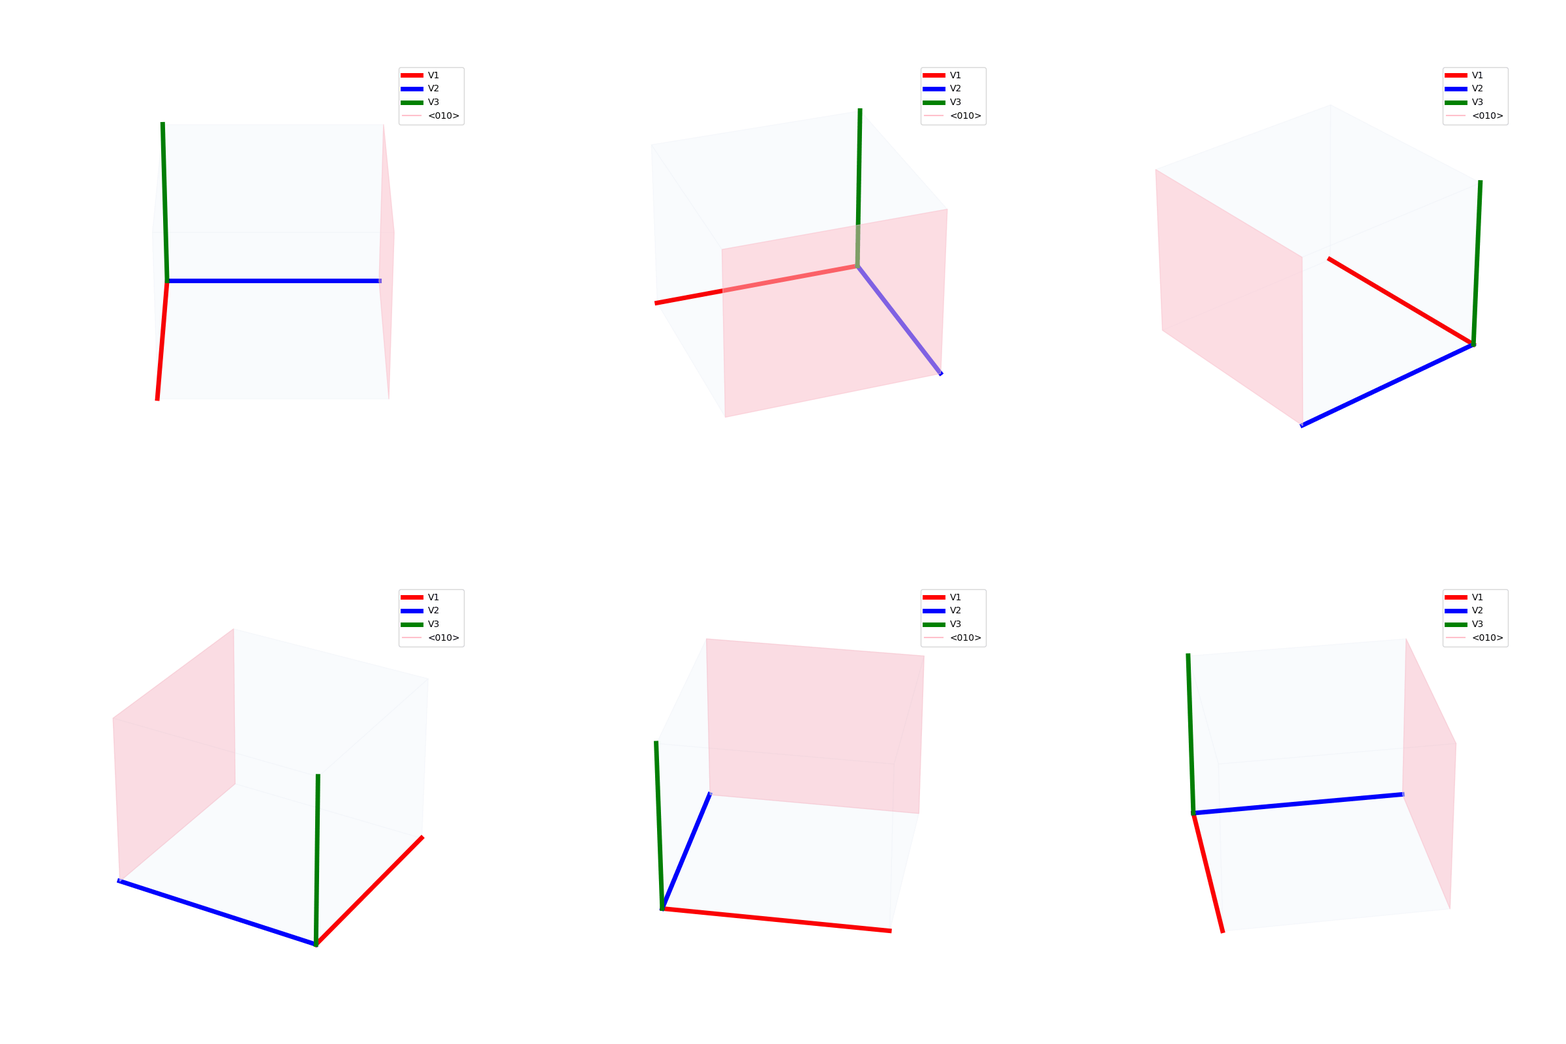
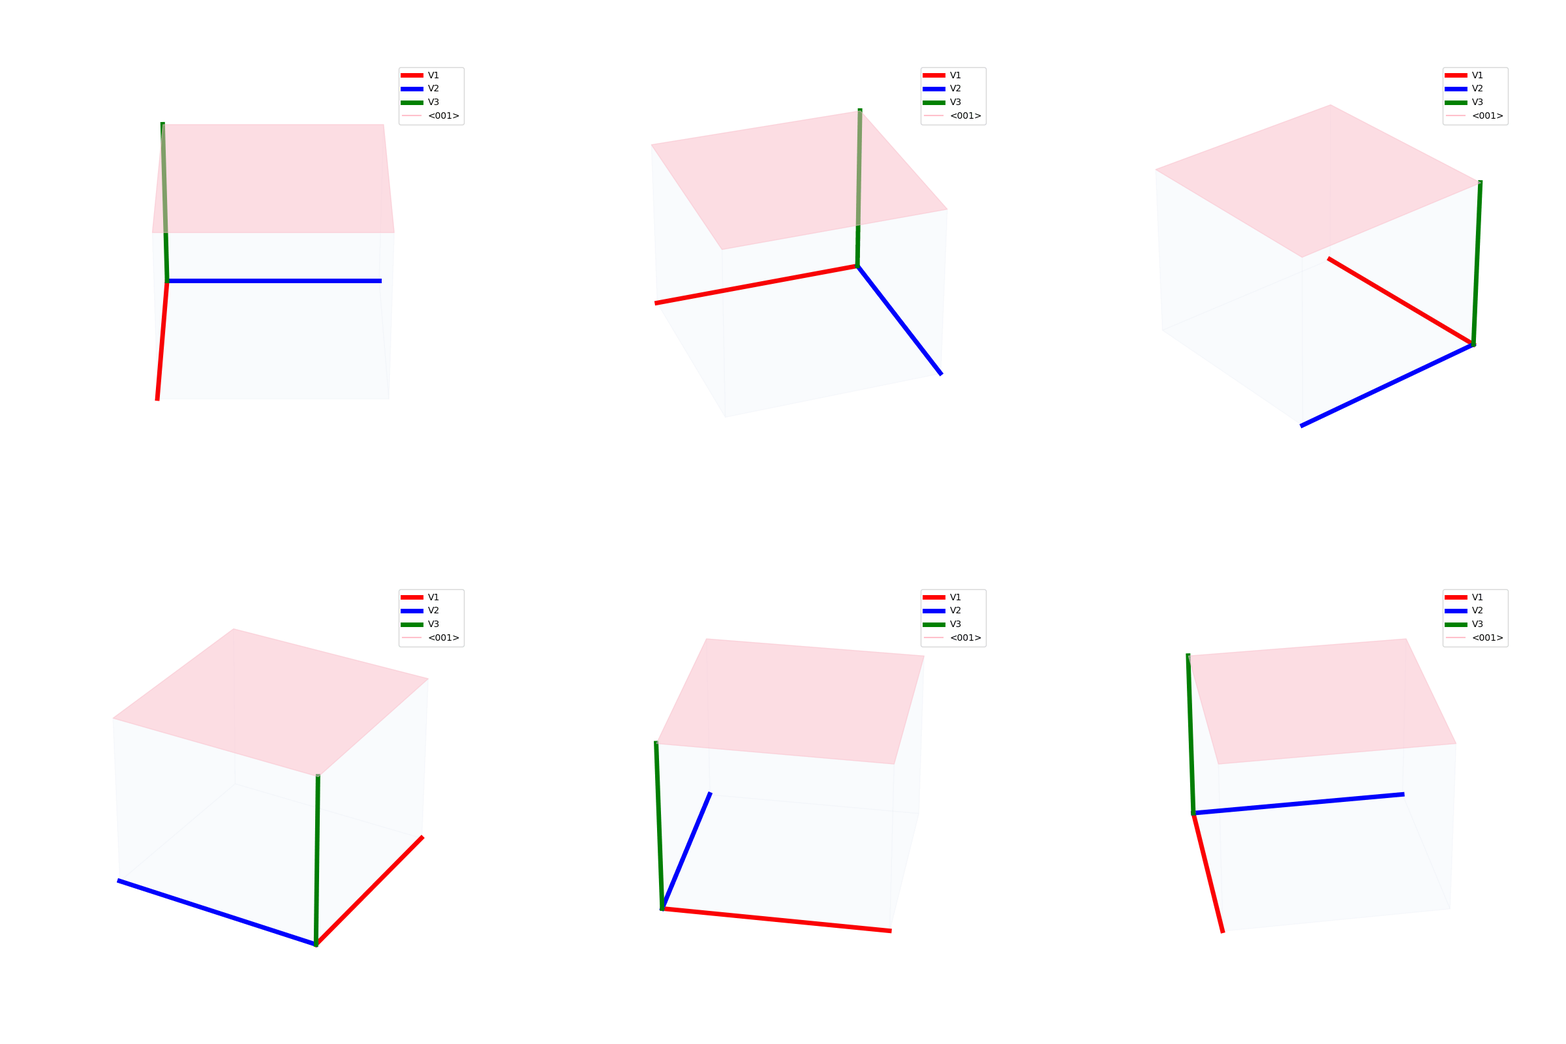
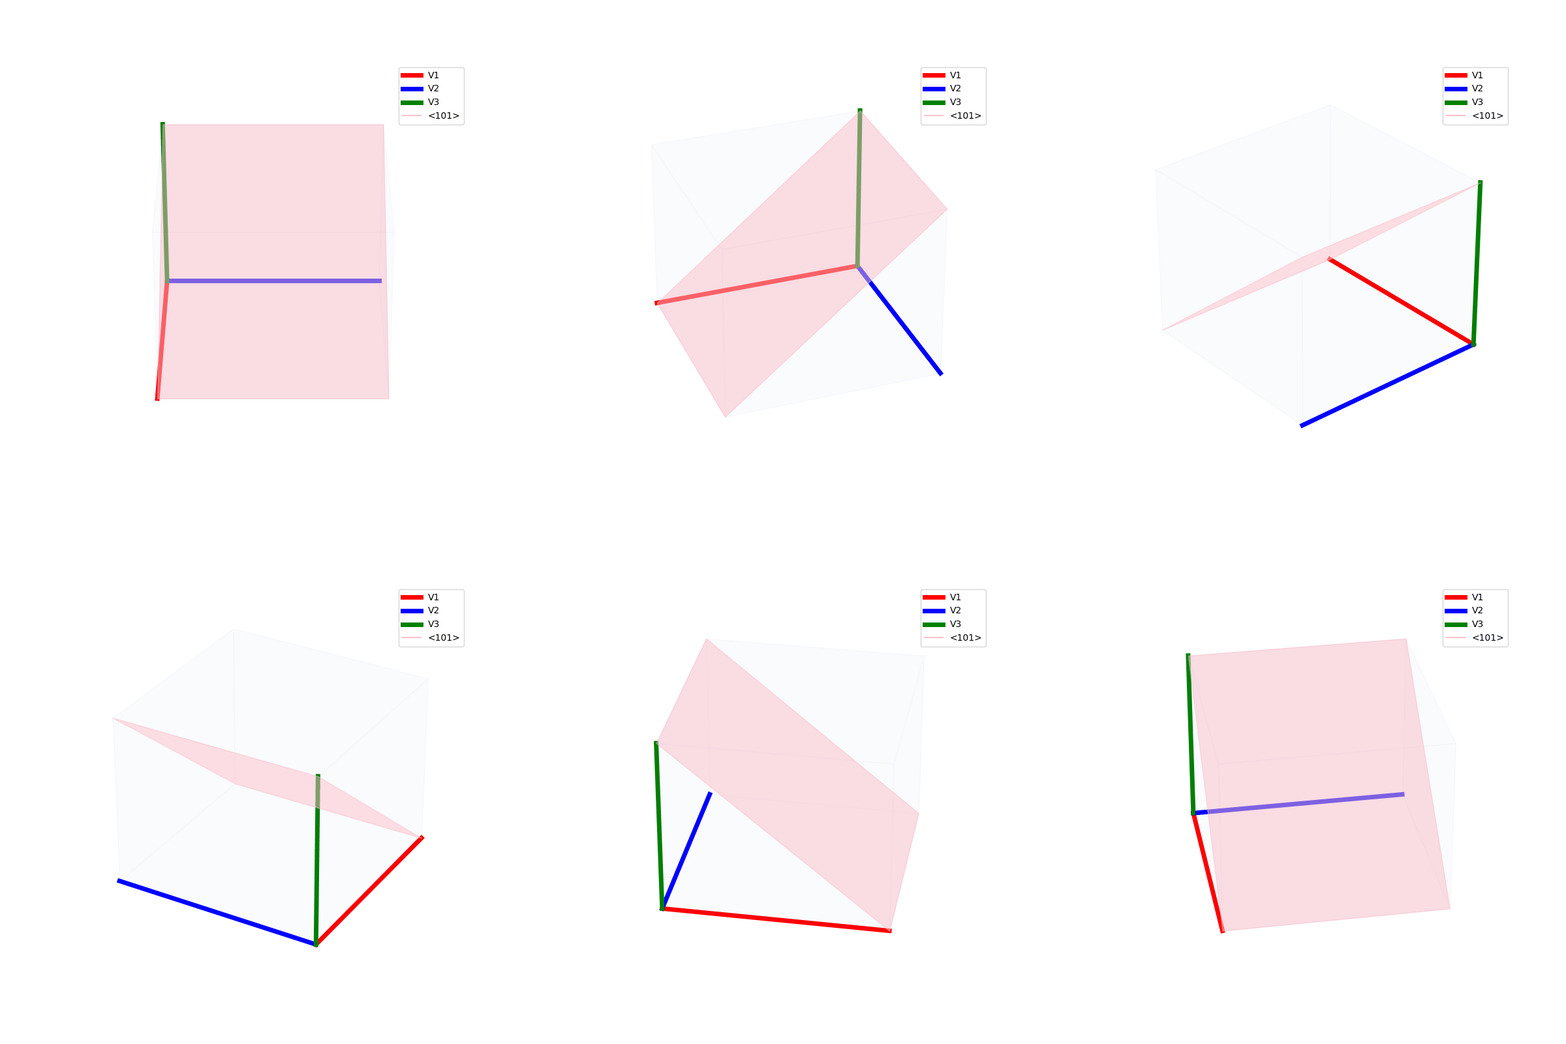
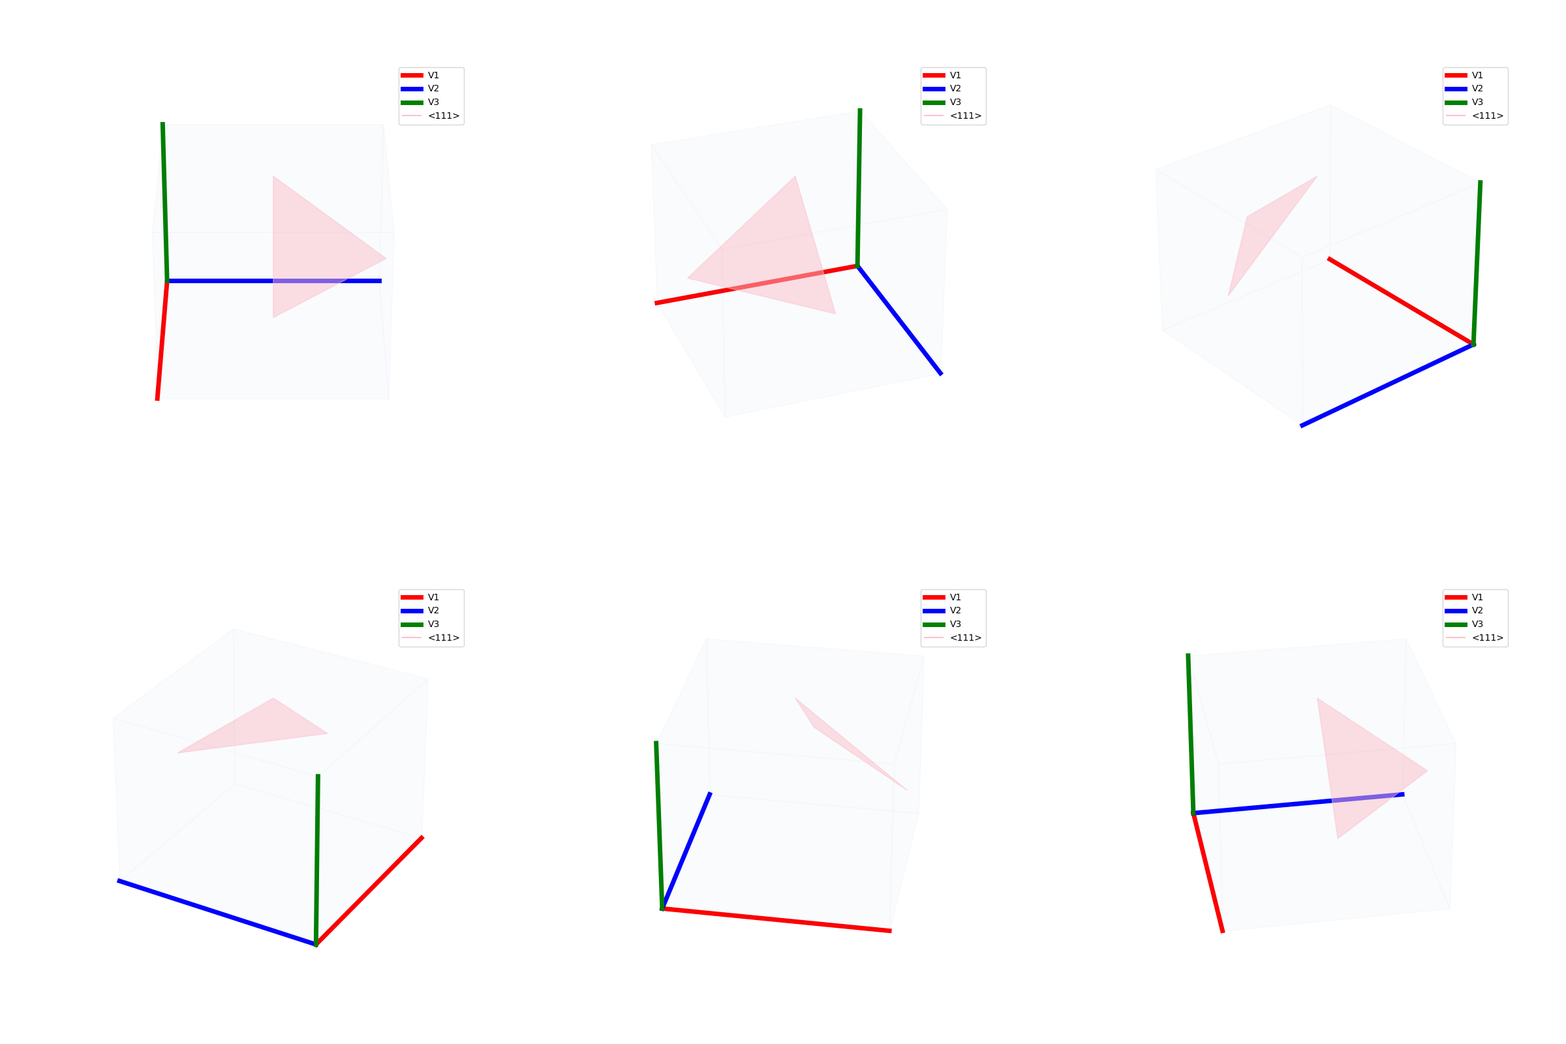
The miller indices are used to denote the planes in crystal lattices.


Lattices are used as a way to map the structure of crystals. A Bravais Lattice is on that is constructed from an infinite array of discrete points by a set of discrete translation operations (primitive vectors, A,B,C in the below figures.)
from PyCrystallography import unit_cell
prim = unit_cell.primitive_cell_2d('square')
from PyCrystallography import lattice
lattice.make_lattice(prim)
plt.show()
from PyCrystallography import unit_cell
prim = unit_cell.primitive_cell_2d('rhombus')
from PyCrystallography import lattice
lattice.make_lattice(prim)
plt.show()
possible unit cell shapes:
trianglesquarerhombushexagon


CODE:
from PyCrystallography import unit_cell
from PyCrystallography import lattice

import matplotlib .pyplot as plt
from mpl_toolkits.mplot3d import Axes3D

#set lattice depths
d = 3

#set primitive vectors
A = [1,0,0]
B = [0,1,0]
C = [0,0,10]

vectors = [A,B,C]

fig = plt.figure('Latiices',figsize=[8,4])
ax1 = fig.add_subplot(121,projection='3d')
ax1.set_title('Bravais')
prim = unit_cell.custom_unit_cell(ax1,vectors)
lattice.make_lattice_3d(ax1,prim,depth=d)

vectors_r = lattice.make_vectors_reciprocal(vectors)

ax2 = fig.add_subplot(122,projection='3d')
ax2.set_title('Reciprocal')
prim = unit_cell.custom_unit_cell(ax2,vectors_r)
lattice.make_lattice_3d(ax2,prim,depth=d,tag='_r')

plt.show()
OUTPUT:
Primitive Vectors
   A =  [1, 0, 0]
   B =  [0, 1, 0]
   C =  [0, 0, 10]

Unit Cell Volume = 10

Reciporocal Primitive Vectors
   A_r =  [6.28318531 0.         0.        ]
   B_r =  [0.         6.28318531 0.        ]
   C_r =  [0.         0.         0.62831853]

Reciprocal Unit Cell Volume = 24.805021344239854

A lattice is made up of cells, the most important being primitive unit cells.
fig = plt.figure(0,figsize=[8,8])
ax = fig.add_subplot(111,projection='3d')
from PyCrystallography import unit_cell
prim = unit_cell.BCC(ax)

fig = plt.figure(1,figsize=[8,8])
ax = fig.add_subplot(111,projection='3d')
from PyCrystallography import lattice
lattice.make_lattice_3d(ax,prim)
plt.show()

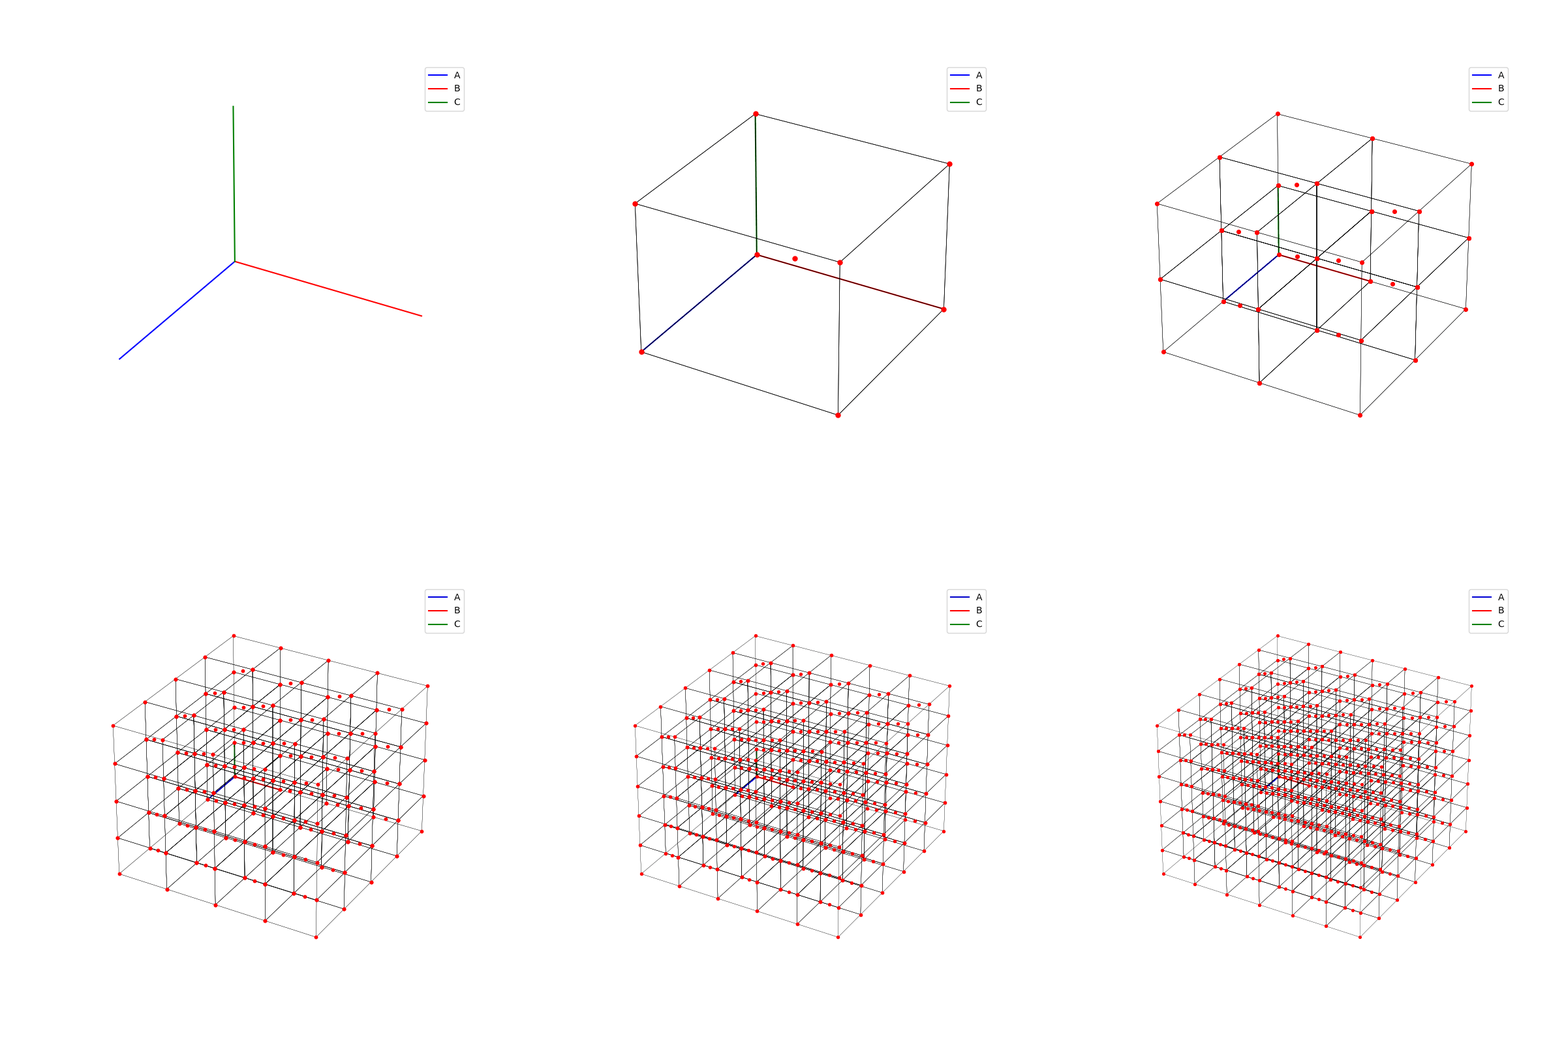
fig = plt.figure(0,figsize=[8,8])
ax = fig.add_subplot(111,projection='3d')
from PyCrystallography import unit_cell
prim = unit_cell.FCC(ax)

fig = plt.figure(1,figsize=[8,8])
ax = fig.add_subplot(111,projection='3d')
from PyCrystallography import lattice
lattice.make_lattice_3d(ax,prim)
plt.show()
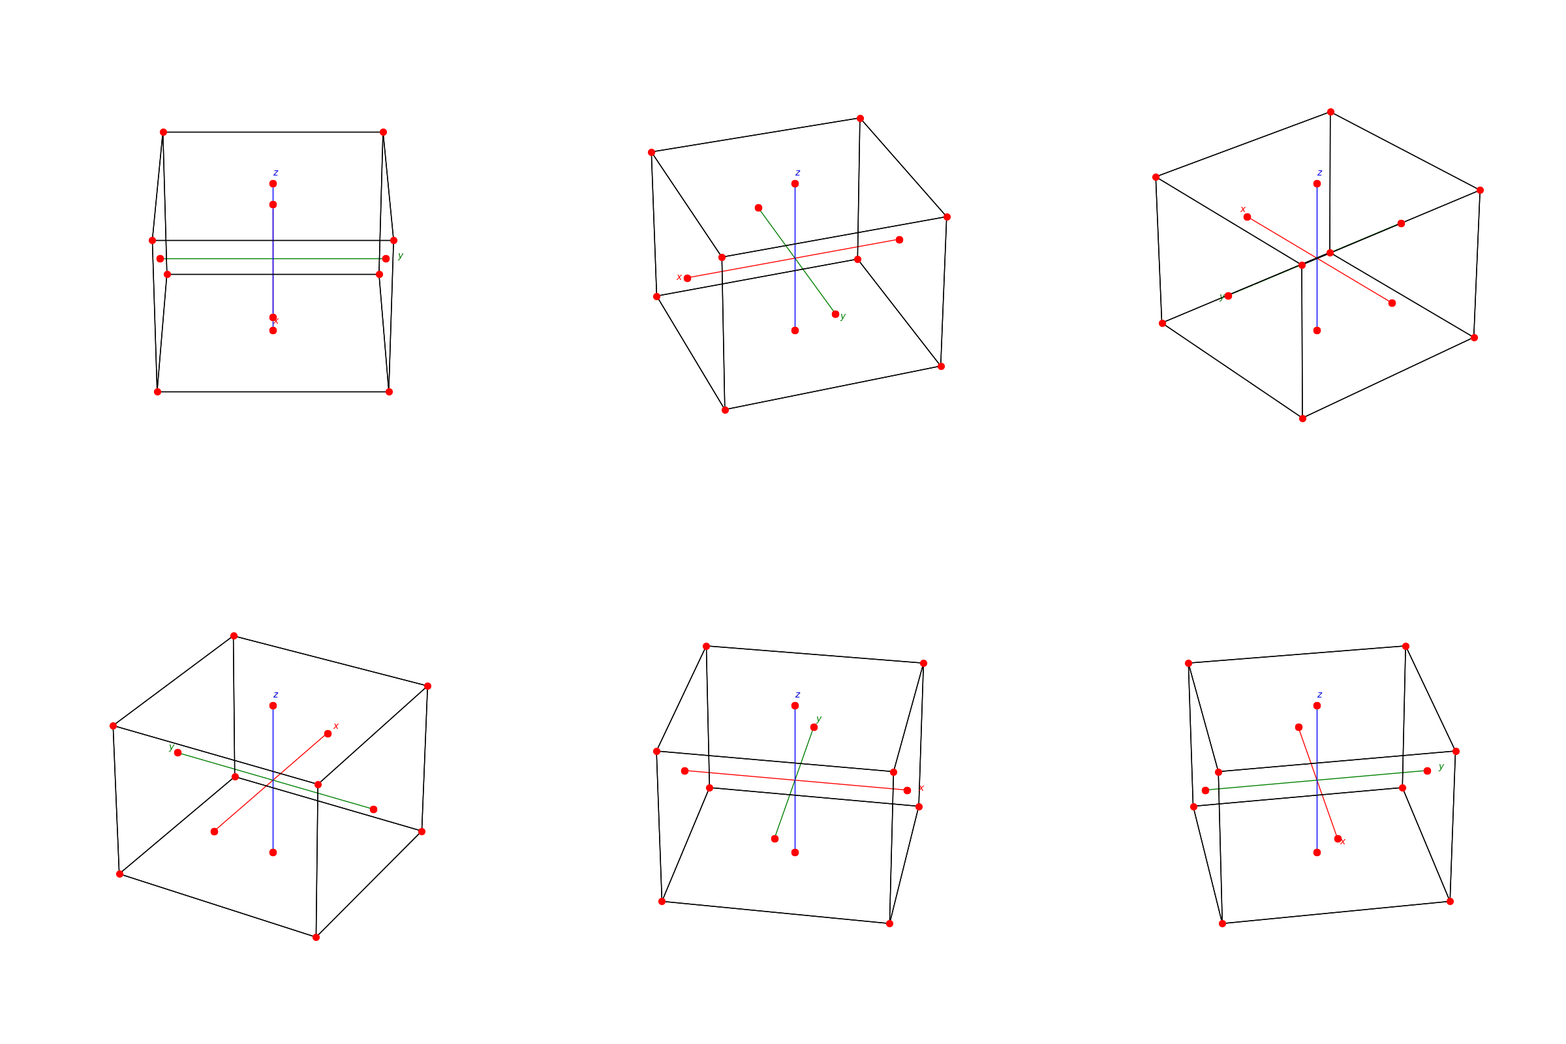
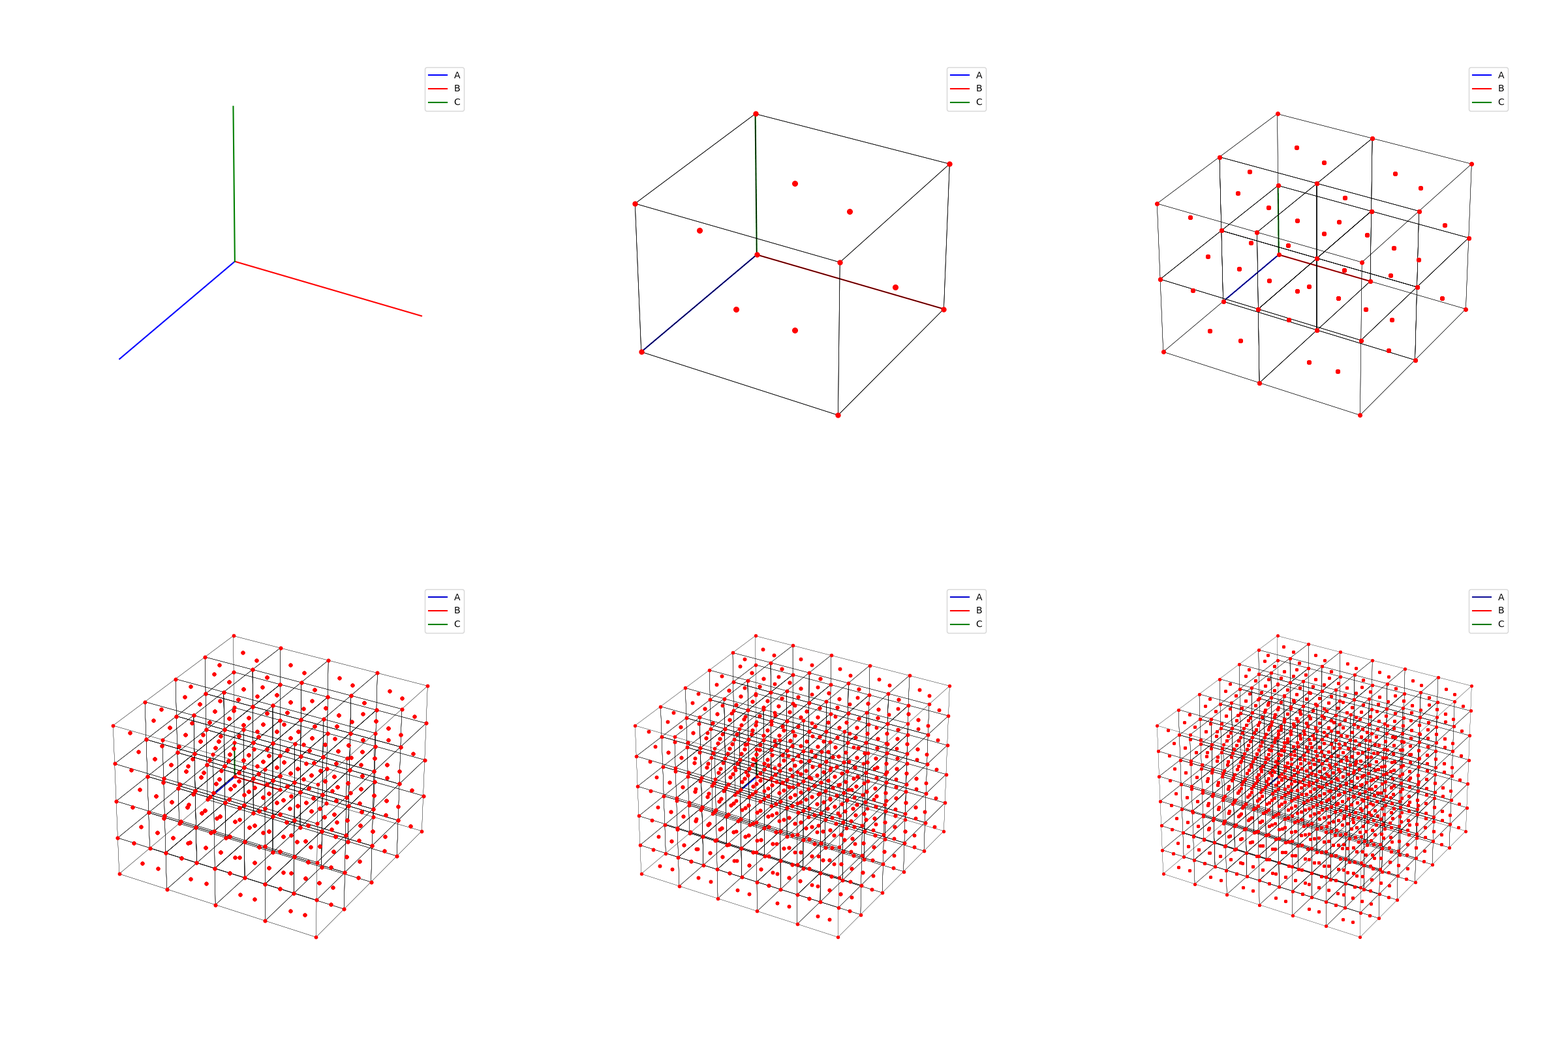
fig = plt.figure(0,figsize=[8,8])
ax = fig.add_subplot(111,projection='3d')
from PyCrystallography import unit_cell
prim = unit_cell.NaCl(ax)

fig = plt.figure(1,figsize=[8,8])
ax = fig.add_subplot(111,projection='3d')
from PyCrystallography import lattice
lattice.make_lattice_3d(ax,prim)
plt.show()
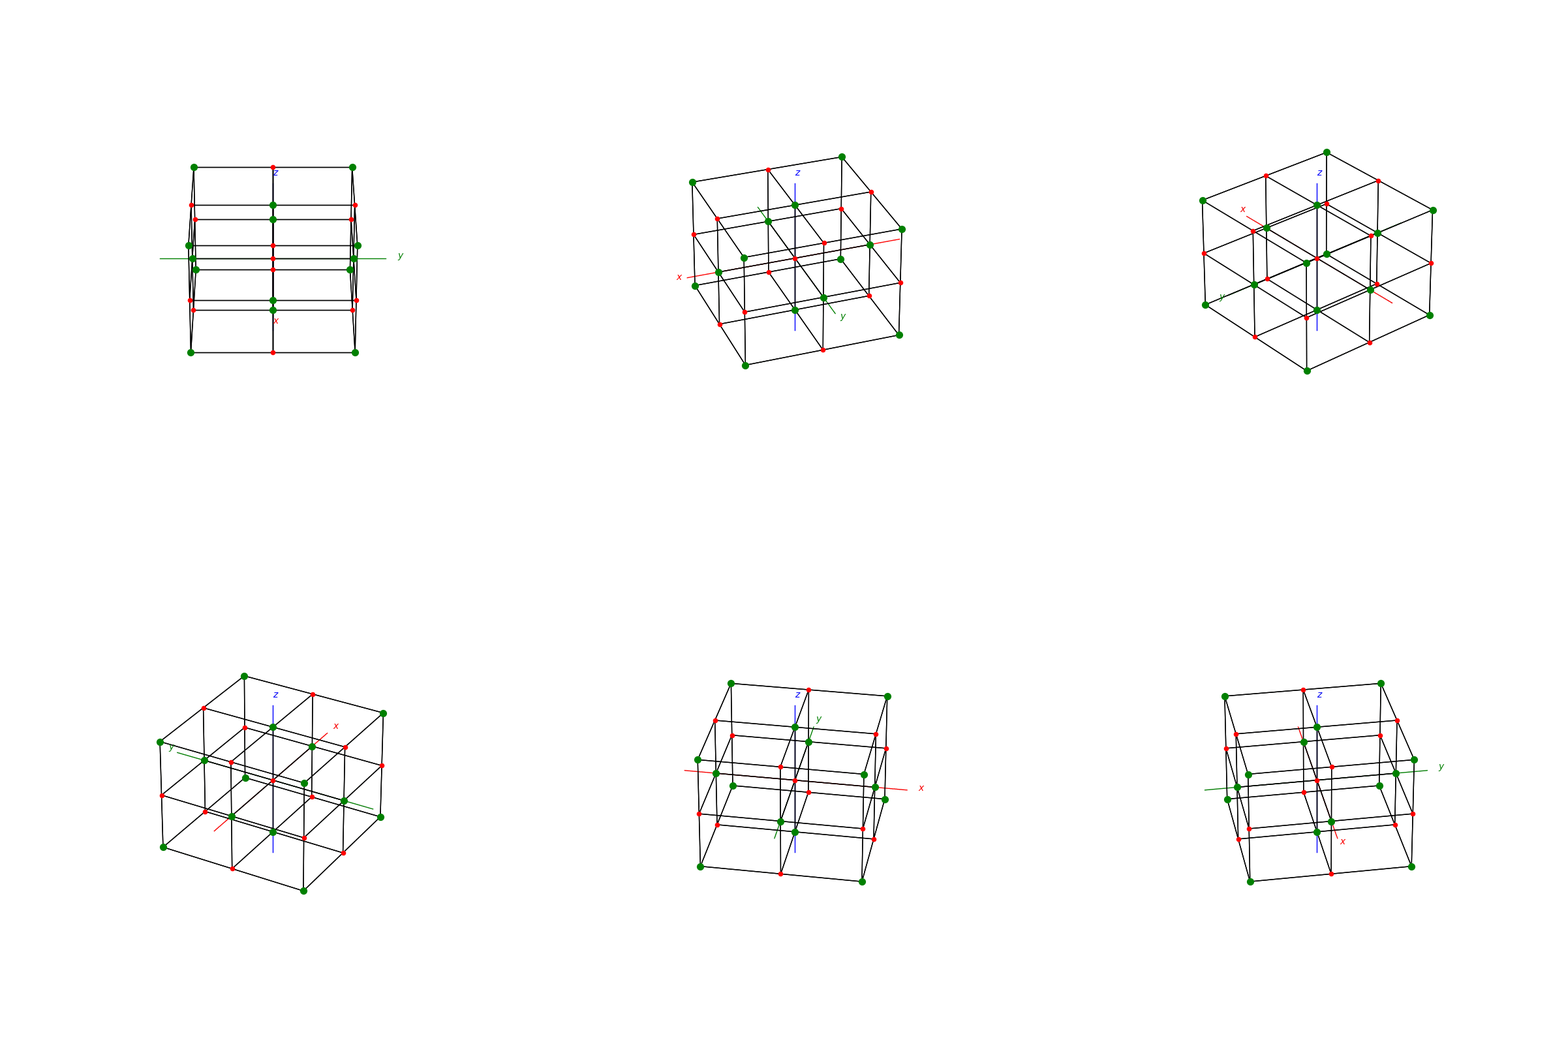
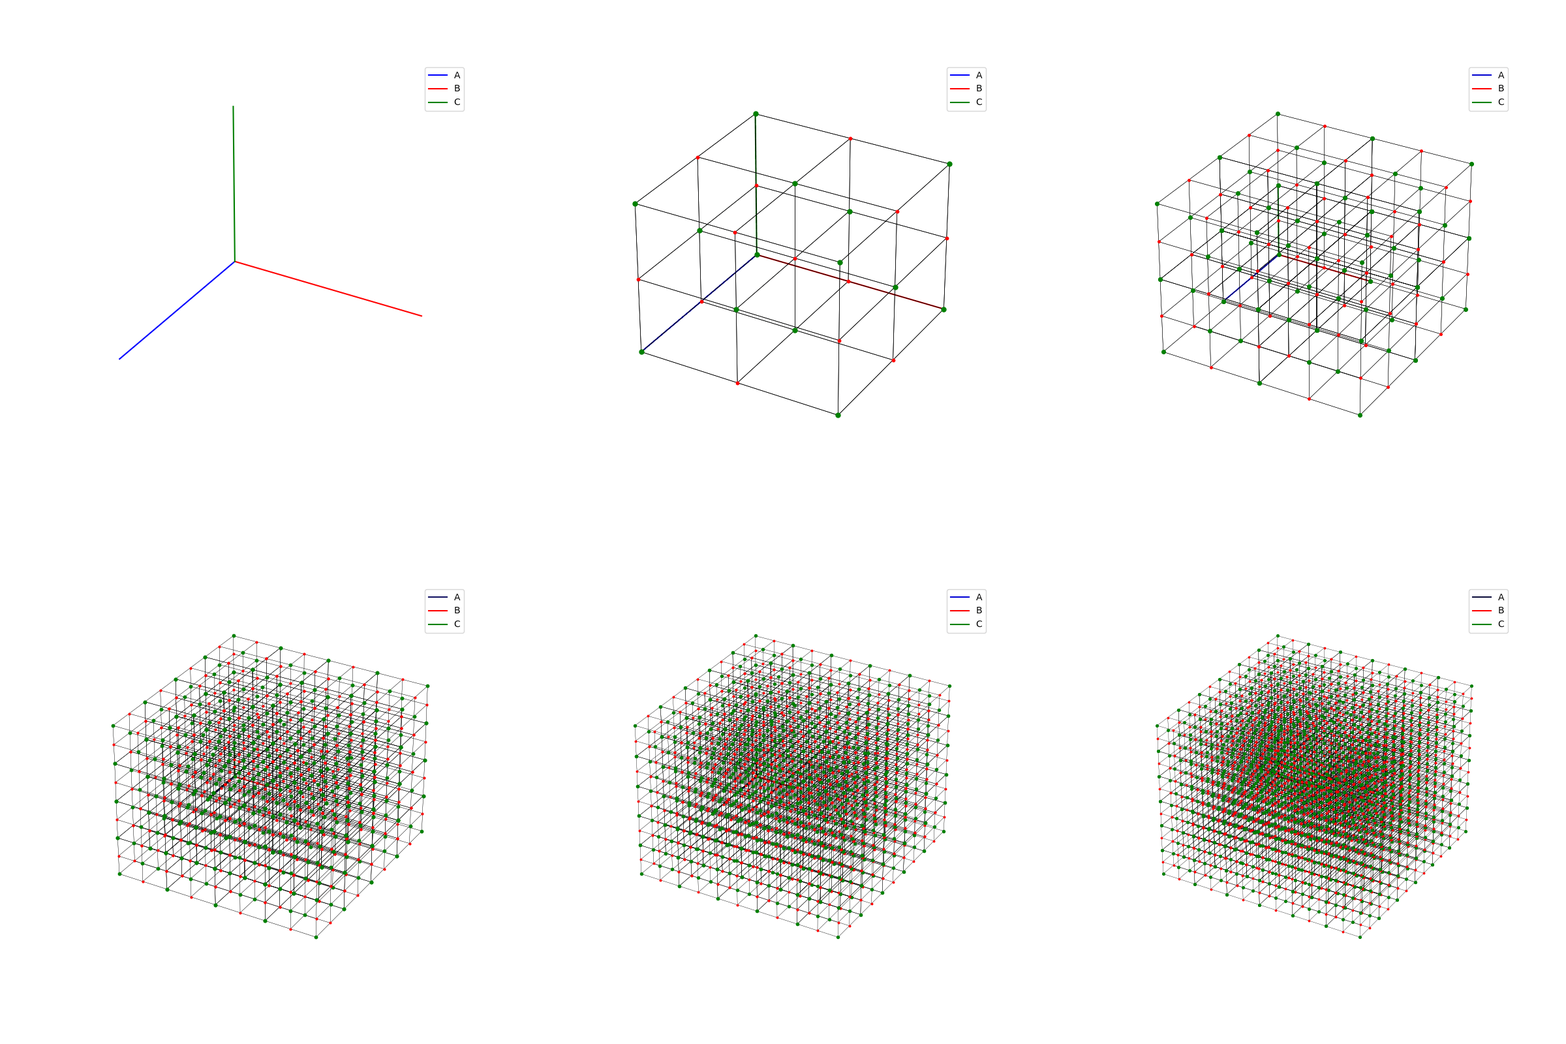
fig = plt.figure(0,figsize=[8,8])
ax = fig.add_subplot(111,projection='3d')
from PyCrystallography import unit_cell
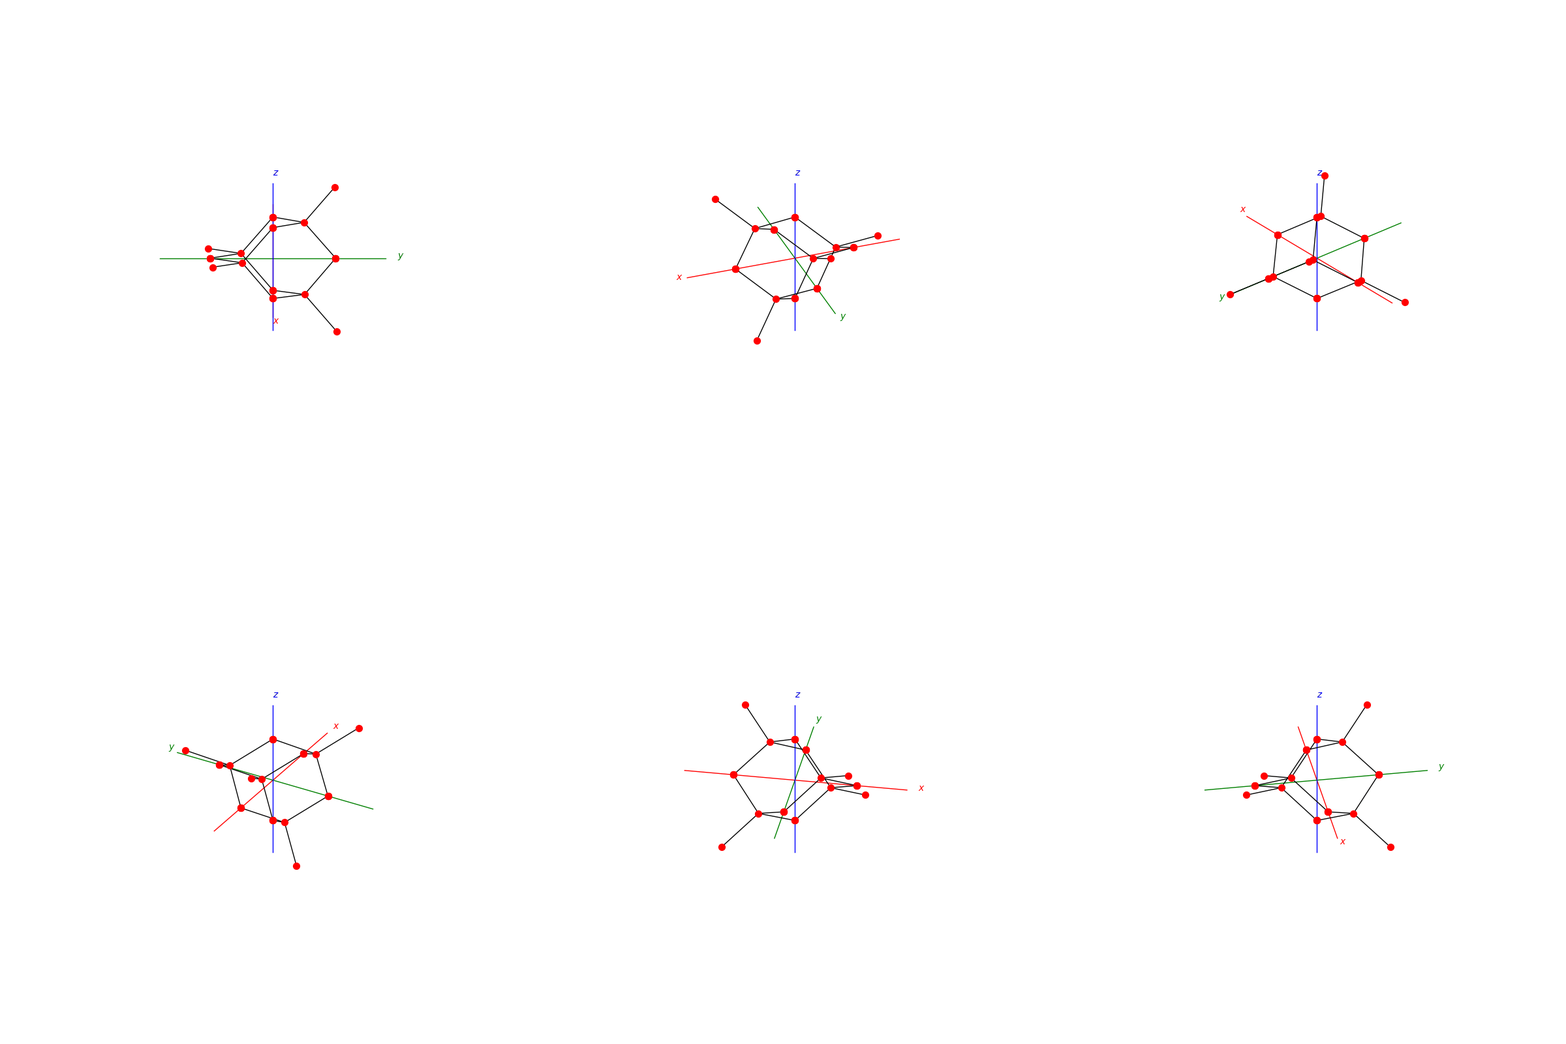
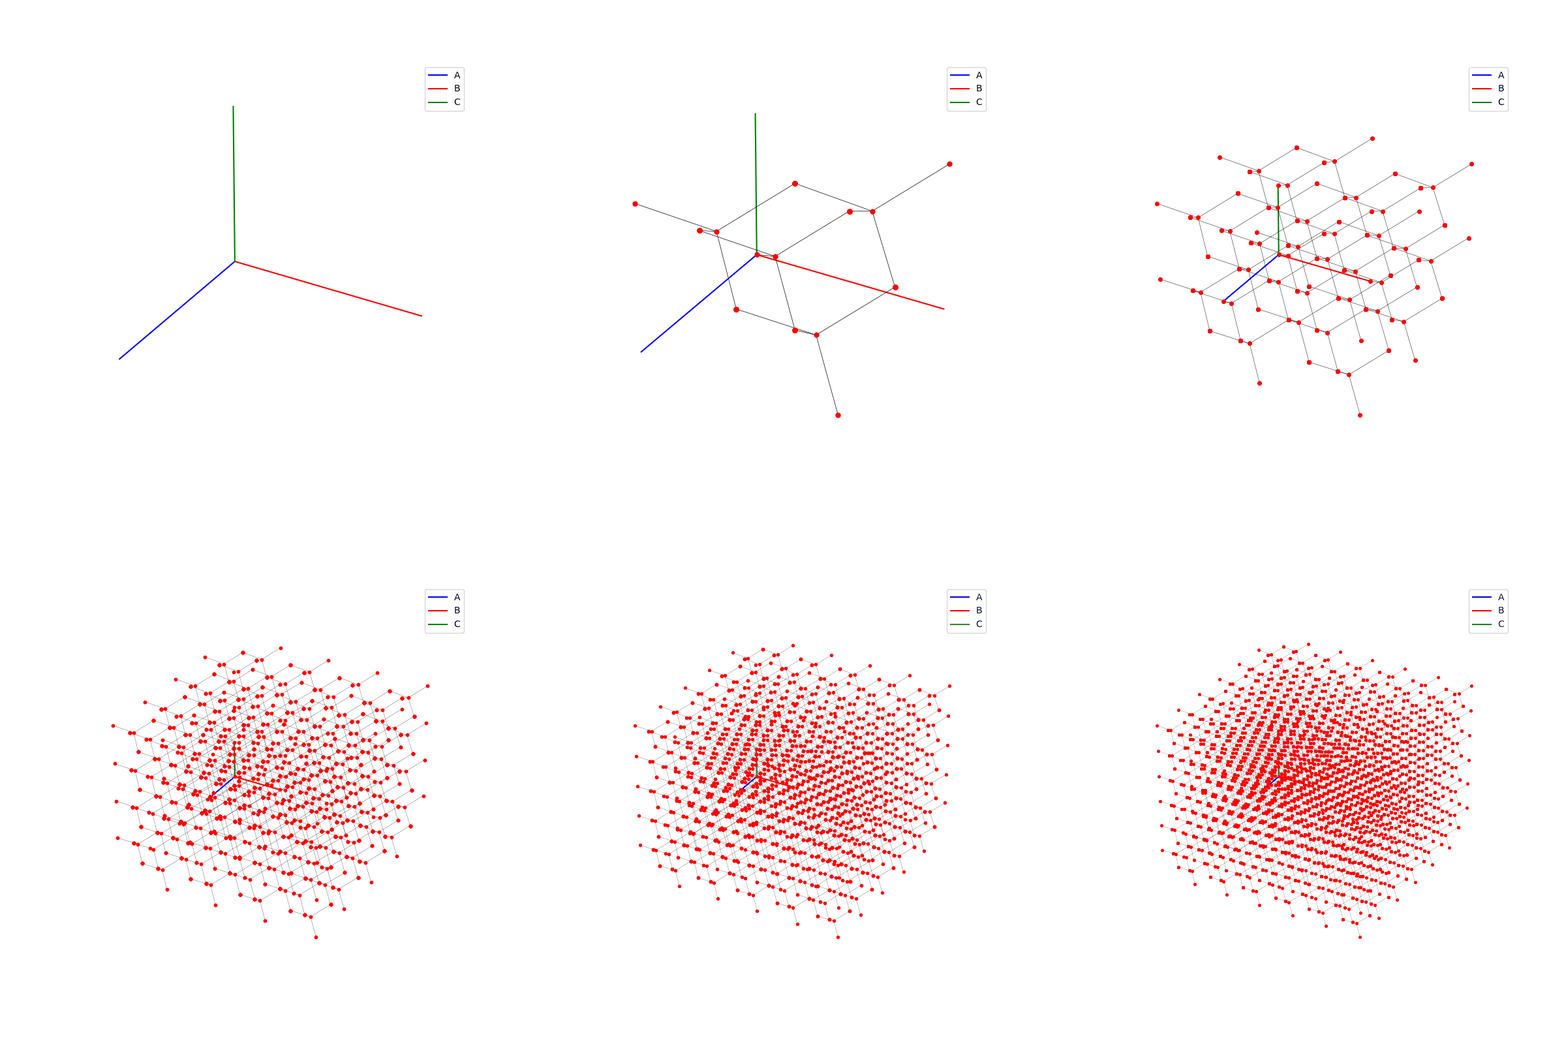
prim = unit_cell.Diamond(ax)

fig = plt.figure(1,figsize=[8,8])
ax = fig.add_subplot(111,projection='3d')
from PyCrystallography import lattice
lattice.make_lattice_3d(ax,prim)
plt.show()
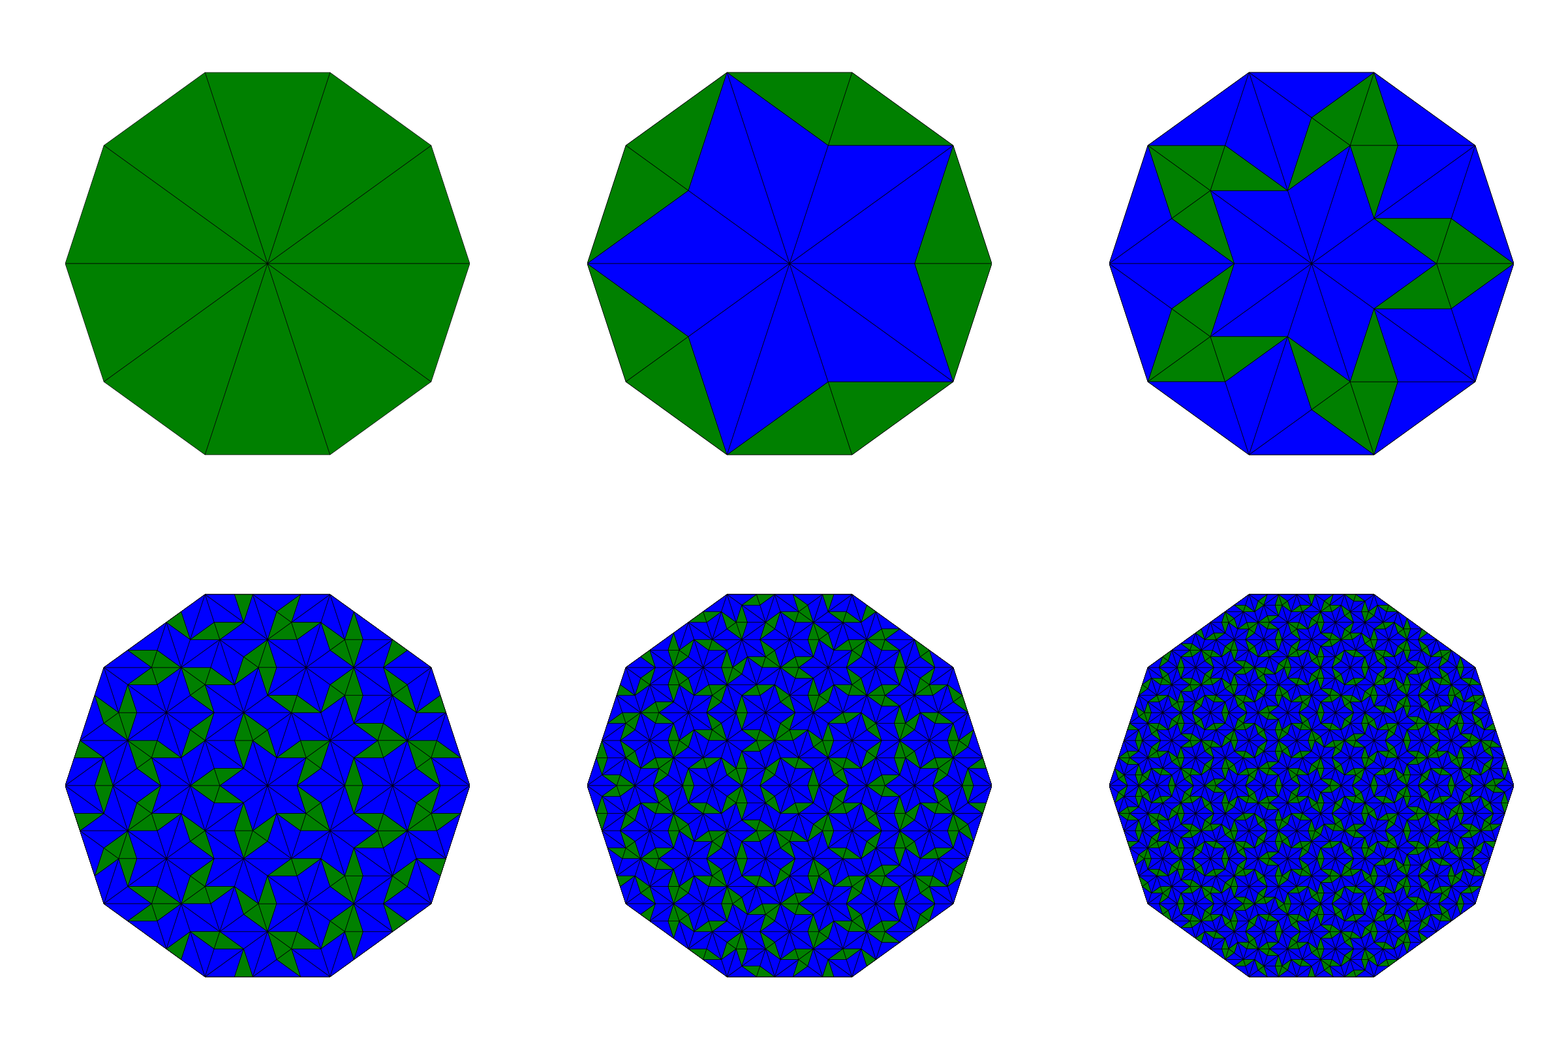
Penrose_Tiling(n,'sun')
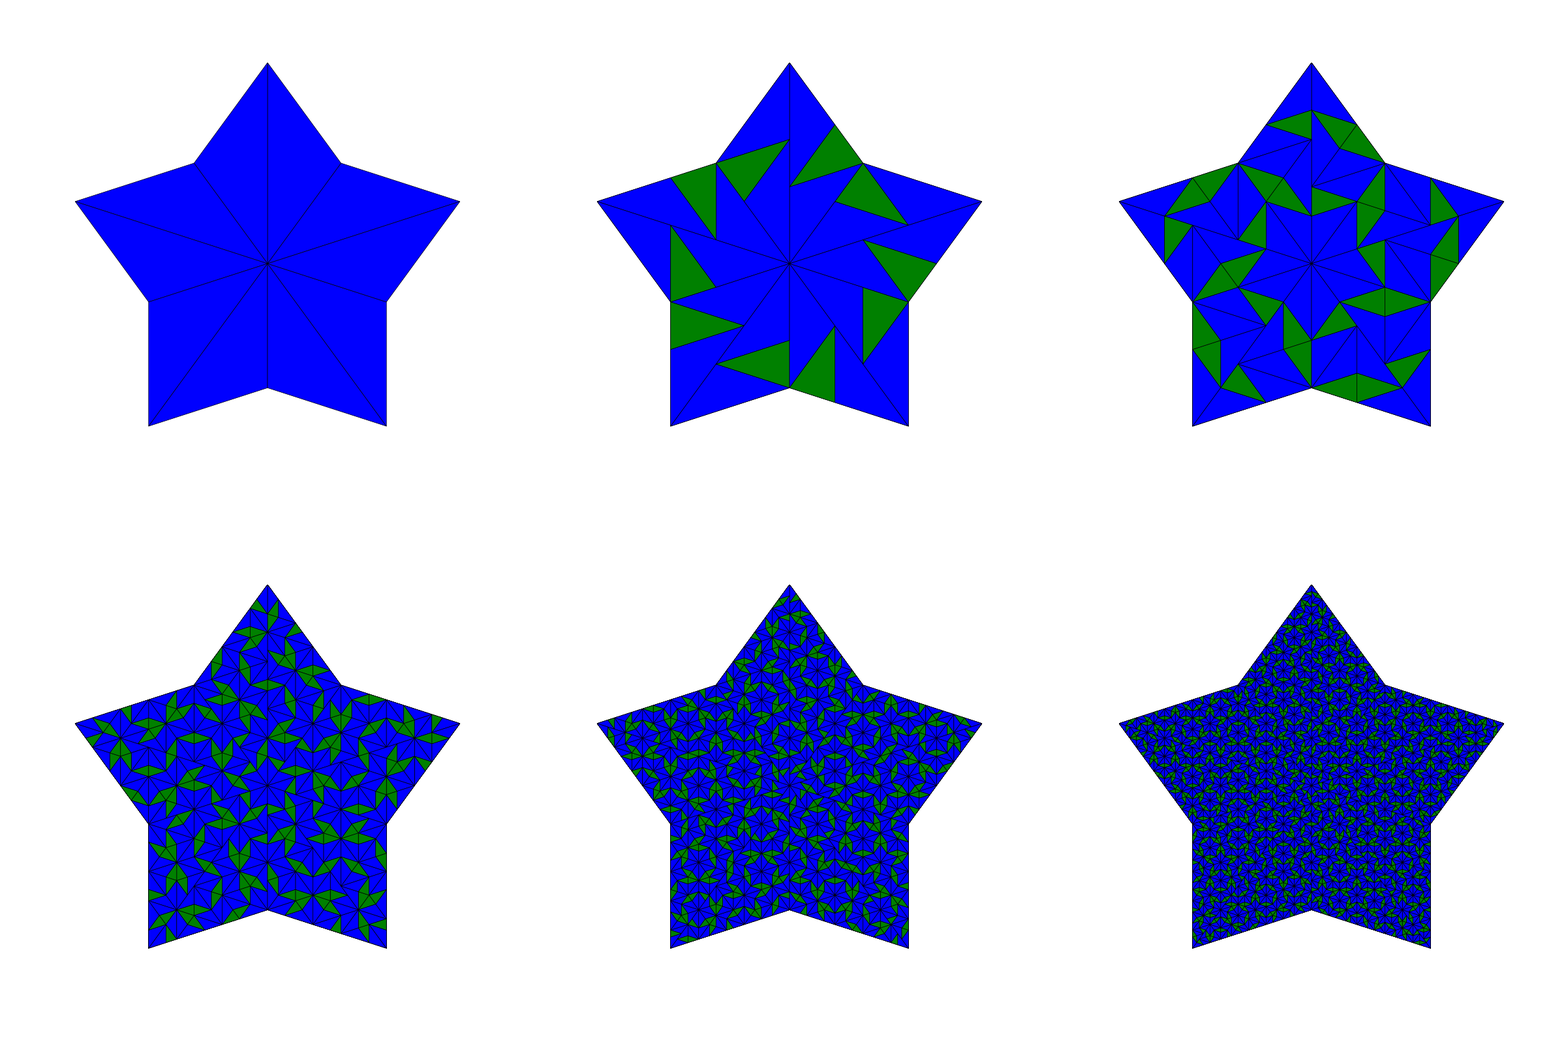
Penrose_Tiling(n,'star')
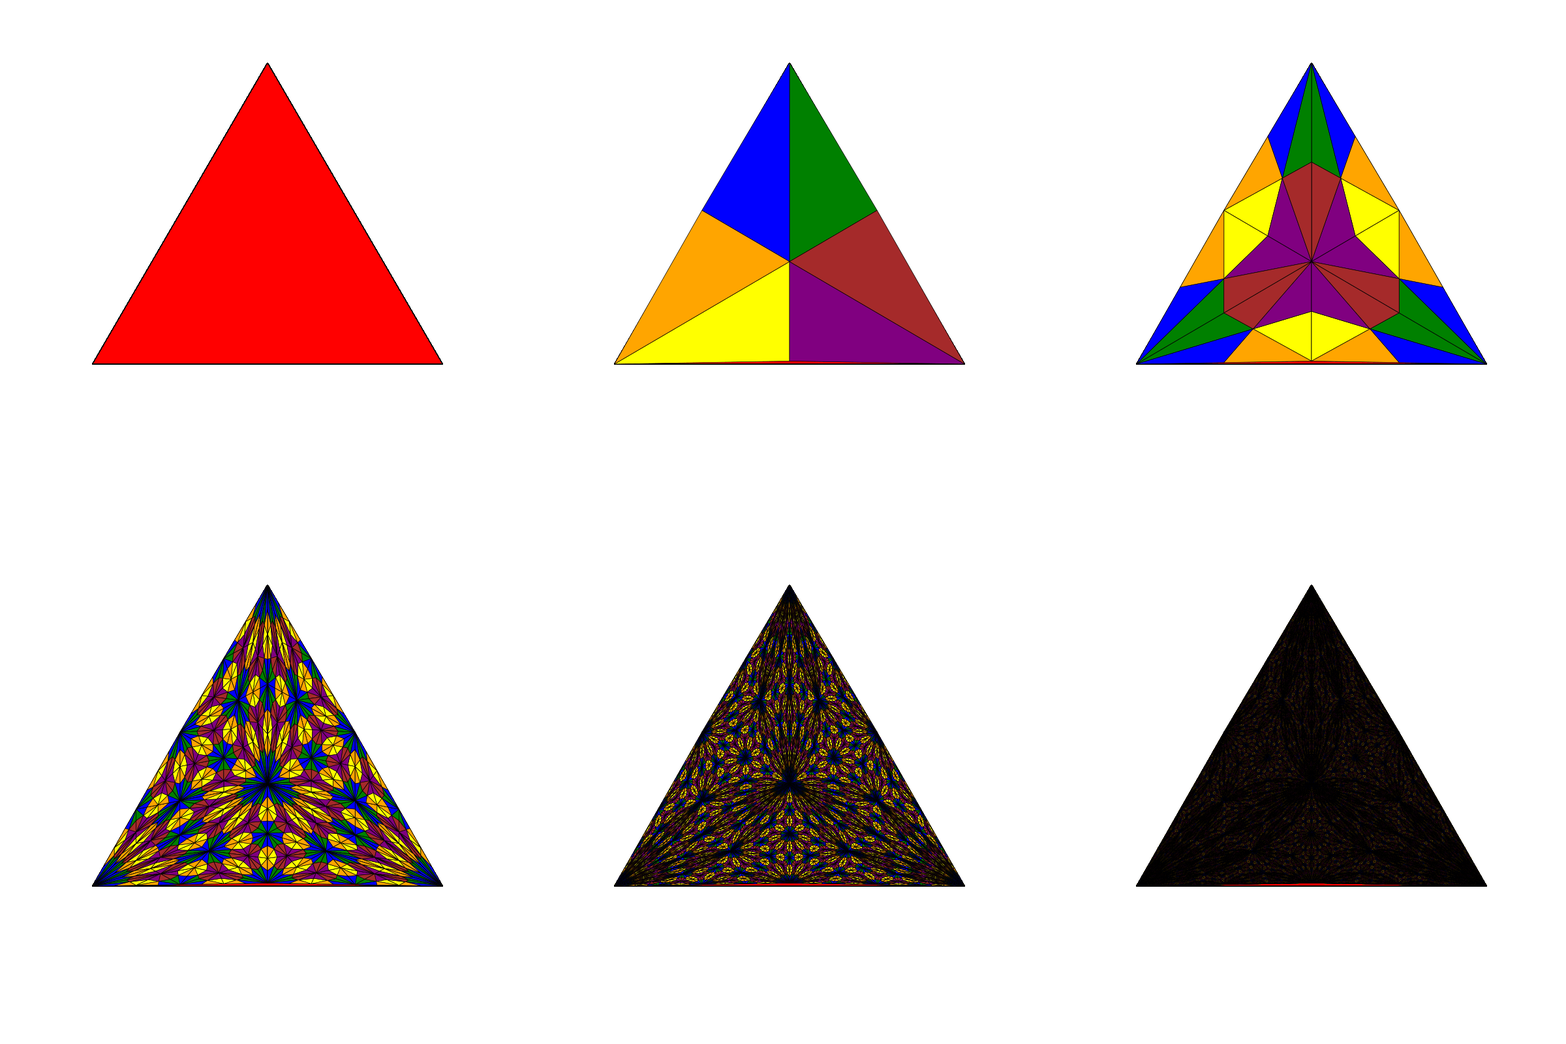
triangle_subdivision(n,'diag')
triangle_subdivision(n,'grid')

|
|
serpinksi_pyramid(n)
|
|
|
menger_cube(n)
|